Introduction
Scientific visualisation is classically defined as the process of graphically displaying scientific data (Tufte, 1983), often in the form of charts, graphs, and maps. By visualizing data in this wa[...]
Objectives
- To show why R is so used and useful to explore the importance of data visualisation in introductory statistics and econometric courses.
- To provide practical tips and strategies for instructors looking to incorporate data visualisation into their courses.
- Easy data visualisation with the packages
esquisse, modelsummary and ggstatplot for graphical displays.
Methods
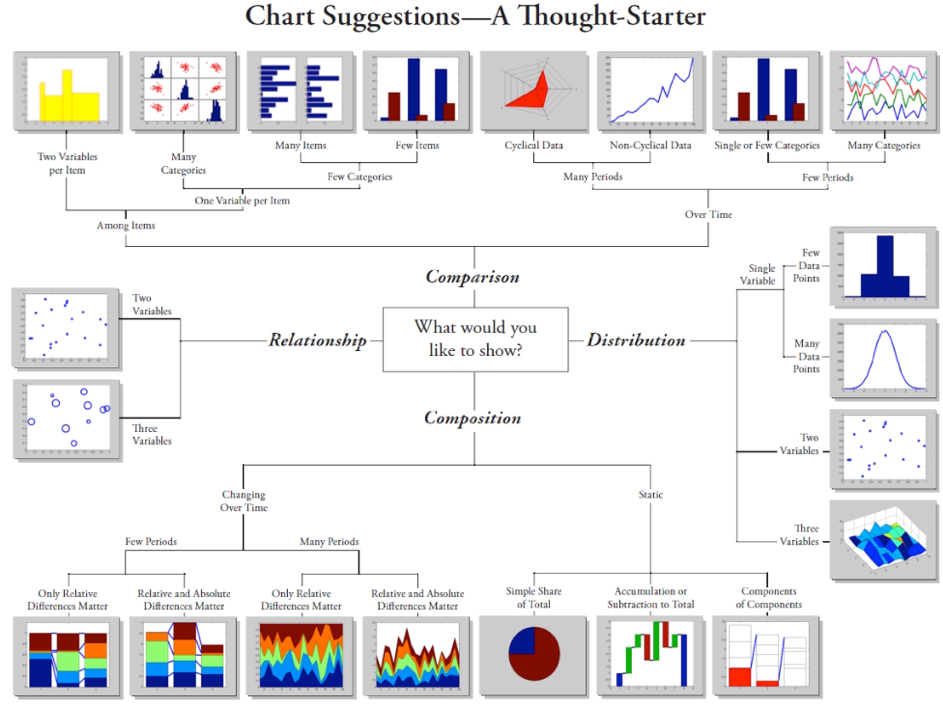
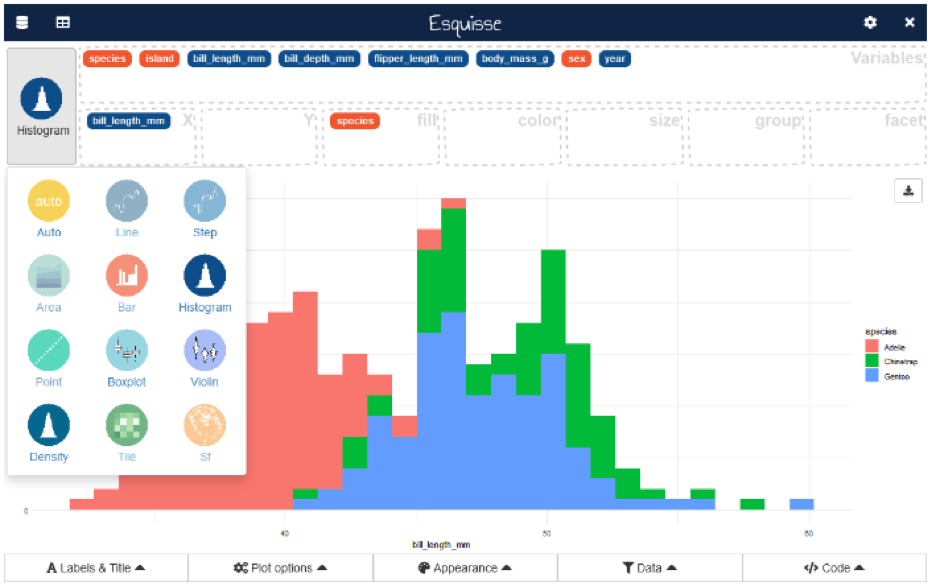
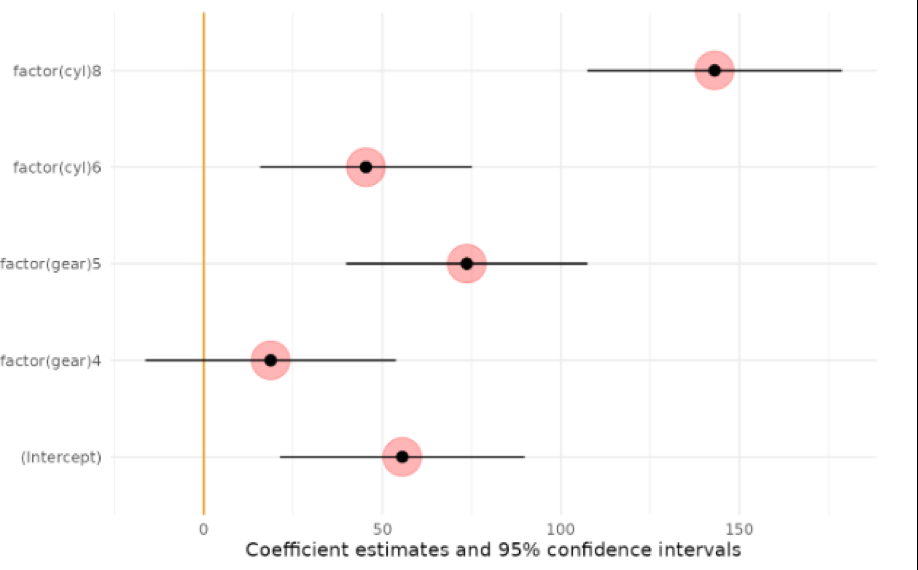
The packages esquisse (Meyer & Perrier, 2023), modelsummary (Arel-Bundock, 2022) and ggstatplot allow to interactively explore data by visualizing it[...]
The pedagogic approach to teaching graphics and data visualisation
Students in introductory courses in business statistics from degrees of Business Administration, Tourism and the Double Degree in Labour Relations and Human Resources were required to create data v[...]
Results and feedback
The benefits of the training were emphasised in student comments and feedback from the end-of-semester course evaluation. Furthermore, students were allowed to assess their progress in statistics T[...]
Table 1: Skill improvement assessment based on statistical subjects
|
|
Identification and
problem solving
|
Analytical
skills
|
Facilitate
comparison
|
Interpretation and
critical thinking
|
|
Descriptive
statistics
|
8.45
|
8.71
|
8.88
|
8.89
|
|
Regression
Analysis
|
7.95
|
7.76
|
8.07
|
7.87
|
|
Time Series
Analysis
|
8.25
|
8.67
|
8.37
|
8.05
|
Students ranked 8.45, 8.71, 8.80, and 8.89 in the skill areas of identification and problem-solving, analytical skills, facilitate comparison and real-world data interpretation for this descriptive[...]
Conclusions
Our findings suggest that the use of statistical software to create data visualisations helps students learn statistics concepts by providing alternative ways to represent data. Especially, the use[...]
According to the students’ feedback, the most useful and effective types of data visualisation for teaching introductory business statistics were: scatterplots, [...]
Data visualisation can lessen difficulties in learning statistics and econometrics by providing opportunities to illustrate analytical findings in graphic form. The use of real-world data is to str[...]
Main References
Tufte, E. G. (1983): The visual display of quantitative information, Cheshire, Connecticut. Graphics Press. ISBN-9780961392147.
Meyer, F. and Perrier, V. (2023): esquisse: Explore and Visualize Your Data Interactively, https://dreamrs.github.io/esquisse/Arel-Bundock, V. (2022). modelsummary: Data and Model Summaries in R, Journal of Statistical Software, 103(1), 1–23. doi:10.18637/jss.v103.i01Hudiburgh, L. M. and Garbinsky, D. (2020): Data visualisation: Bringing data to life in an introductory statistics course, Journal of Statistical Education, 28(3), pp. 262–279.
Nolan, D and Perrett, J. (2016): Teaching and learning data visualisation: Ideas and assignments, The American Statistician, 70(3), pp. 260–269.