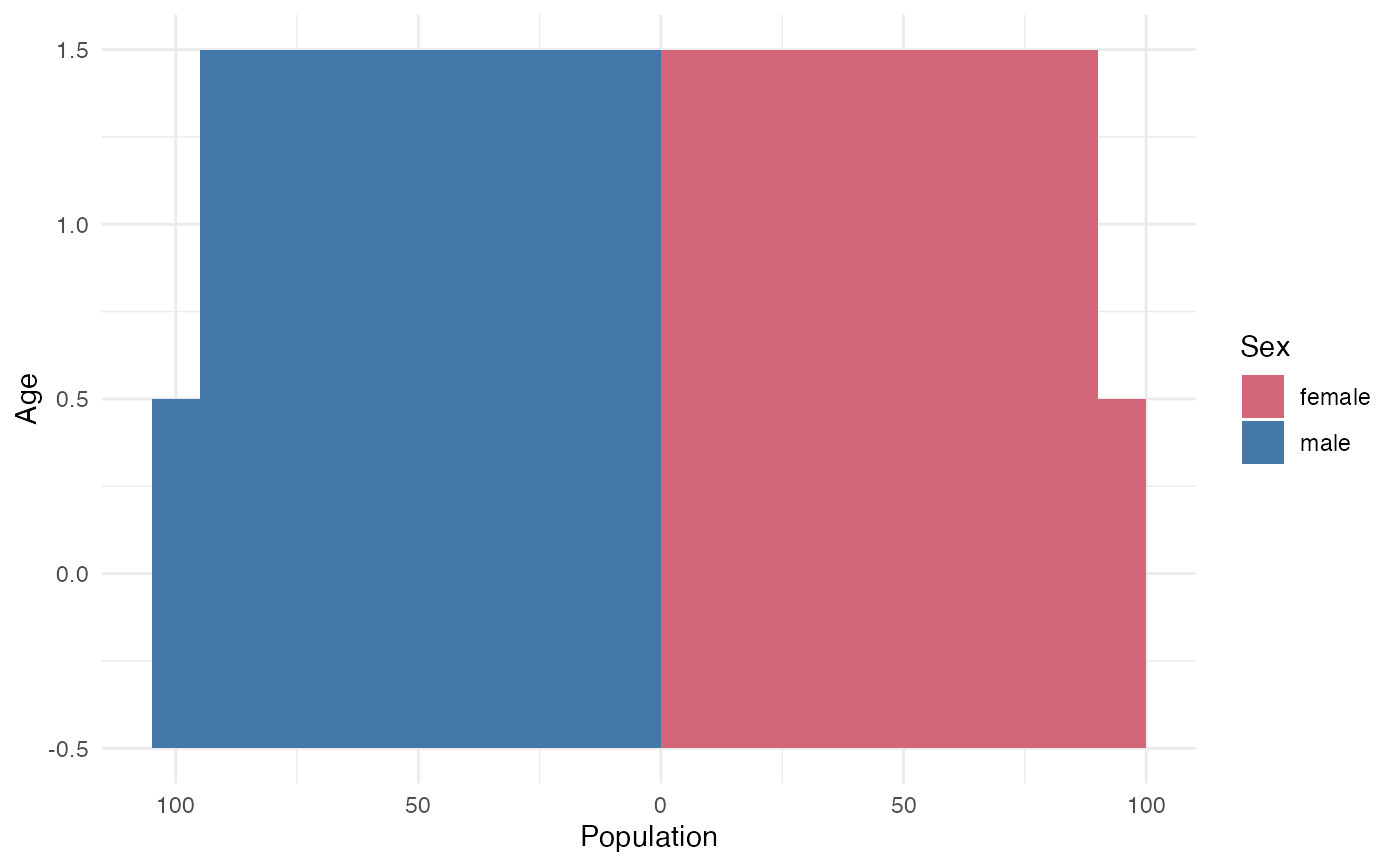
Draws a population pyramid for one province and year from
age-disaggregated population data. Requires an age/sex breakdown, so it
operates on get_ine_population()'s output, not get_ine_demog()'s
population_total indicator.
plot_population_pyramid(pop_df, year, region = NULL, title = NULL)Arguments
- pop_df
Population tibble as returned by
get_ine_population()$data(columnsprovince_name,year,age,female,male).- year
Numeric, the year to plot.
- region
Optional character vector to subset by province name (regular expressions allowed, matched against
province_name). If more than one province matches, counts are summed across them. IfNULL(default), all provinces are summed (national pyramid).- title
Optional plot title.
Value
A ggplot object.